LAB 4D: Interpreting Correlations
Lab 4D - Interpreting correlations
Directions: Follow along with the slides, completing the questions in blue on your computer, and answering the questions in red in your journal.
Some background...
-
So far, we’ve learned about measuring the success of a model based on how close its predictions come to the actual observations.
-
The correlation coefficient is a tool that gives us a fairly good idea of how these predictions will turn out without having to make predictions on future observations.
-
For this lab, we will be using the
moviedata set to investigate the following question:Which variables are better predictors of a movie's
critics_ratingwhen the predictions are made using a line of best fit?
Correlation coefficients
-
The correlation coefficient describes the strength and direction of the linear trend.
-
It's only useful when the trend is linear and both variables are numeric.
-
(1) Are these variables linearly related? Why or why not?
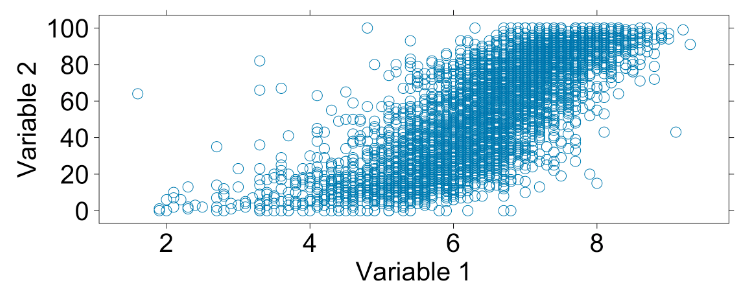
Correlation review I
-
Correlation coefficients with values close to 1 are very strong with a positive slope. Values close to -1 means the correlation is very strong with a negative slope.
-
(2) Does this plot have a positive or negative correlation?
Correlation review II
-
Recall that if there is no linear relation between two numerical variables, the correlation coefficient is close to 0.
-
(3) What do you guess the correlation coefficient will be for these two variables?
The movie data
-
(4) Write and run code loading the
moviedata using thedatacommand. -
The data comes from a variety of sources like IMDB and Rotten Tomatoes.
– The
critics_ratingcontains values between 0 and 100, 100 being the best.– The
audience_ratingcontains values that range between 0 and 10, 10 being the best.–
n_criticsandn_audiencedescribe the number of reviews used for the ratings.–
grossandbudgetdescibes the amount of money the film made and took to make.
Calculating Correlation Coefficients!
-
We can use the
cor()function to find the particular correlation coefficient of the variables from the previous plot, which happen to beaudience_ratingandcritics_rating. -
But note, the
cor()function removes any observations which contain anNAvalue in either variable. -
(5) Write and run code calculating the correlation coefficient for these variables using the
cor()function. The inputs to the functions work just like the inputs of thexyplotfunction.
Now answer the following.
-
(6) What was the value of the correlation coefficient you calculated?
-
(7) How does this actual value compare with the one you estimated previously?
-
(8) Does this indicate a strong, weak, or moderate association? Why?
-
(9) How would the scatterplot need to change in order for the correlation to be stronger?
-
(10) How would it need to change in order for the correlation to be weaker?
Correlation and Predictions
-
(11) Find the two variables that look to have the strongest correlation with
critics_rating.– (12) Compute the correlation coefficients for
critics_ratingand each of the two variables.– (13) Use the correlation coefficient to determine which variable has a stronger linear relationship with
critics_rating. -
(14) Write and run code fitting two
lm()models to predictcritics_ratingwith each variable and compute the MSE for each.– (15) Use the MSE to determine which variable is a better predictor of
critics_rating. -
(16) How are the correlation coefficient and the MSE related?
On your own
-
(17) Select two different numerical variables from the
moviedata. Plot the variables using thexyplot()function.– (18) Would calculating a correlation coefficient for the two variables be appropriate? Justify your answer.
– (19) Predict what value you think the correlation coefficient will be. Compare this value to the actual value. Finally, interpret what the actual correlation coefficient means.
-
(20) Work with your classmates to determine which two variables have the strongest correlation coefficient.
– (21) Why do you think these variables are so strongly related?
– (22) Is using the correlation coefficient to describe the relationship appropriate and why/why not?